Backhaul Traffic Availability
The Backhaul Traffic Availability (BTA) metric follows the methodology described in ETSI TR 104 141 V1.1.1 published by the European Telecommunications Standards Institute.
Backhaul Traffic Availability (%): provides a powerful metric for evaluating the performance of an Adaptive Modulation link. This value uses a probability distribution to model Traffic Demand over time and determines the probability that the required capacity will be available.
Traffic Demand - Beta Distribution Definition
The capacity demand for a link is modeled using a Beta Probability Distribution. The distribution parameters are saved with the Calculation Options of a Link File or Design Rules File.
The Beta Probability Distribution parameters are defined using the Traffic Demand Dialog. To view this dialog, click the Traffic Demand button in the Application – Radio type section of the Calculation Options control. Or, from the Transmission Analysis Module, click Operations – Define Traffic Demand - Beta Distribution (or Ctrl+T)
Traffic Demand Parameters
The Traffic Demand can be defined by 3 parameters:
- Minimum and Maximum Demand (Mbps): The minimum and maximum possible capacity demand. The demand for capacity will always be between or equal to these values.
- Average Demand (Mbps): The average traffic demand.
With these values defined, you can click the Set BTA Lowest Bound button to generate a worst case distribution.
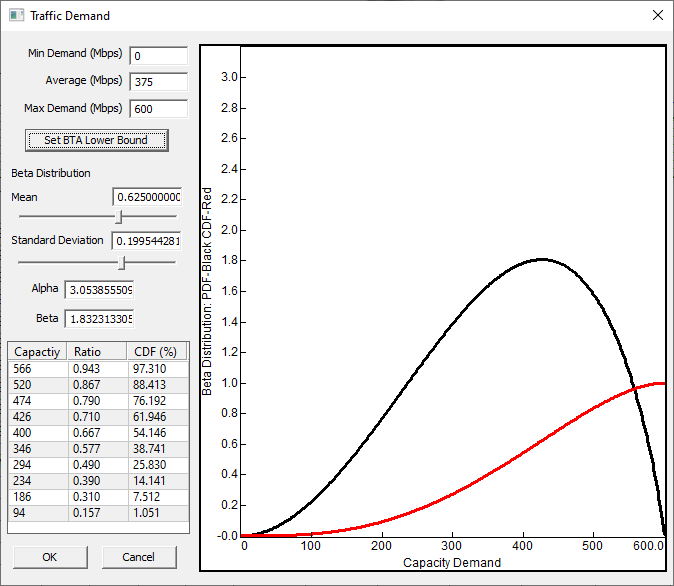
Mean and Standard Deviation: These controls can be used to directly edit the distribution parameters. Alpha and Beta values for the Beta distribution will be calculated from these values. The slider controls can be used to adjust these values between the range of valid inputs.
Alpha and Beta values: These values define the Beta distribution and determine the shape of the Probability Density Curve. They can be entered manually or calculated from a Mean and Standard Deviation.
Beta Distribution Results Table
When the four parameters have been defined, a Beta Distribution can be used to model the demand between the Minimum and Maximum capacity values. A chart will be displayed showing the Probability Density Function (PDF) in black and the Cumulative Distribution Function (CDF) in red.
If the dialog was opened from the Transmission Analysis module, a table will also be populated with the results of the Cumulative Distribution Function at the specific Total Capacities for the current link.
The following values are shown in the table:
- Capacity: The Total Capacity at this modulation state.
- Ratio: The ratio of this capacity between the minimum and maximum capacities defined for the Traffic Demand. This value will be 0.0 for capacities less than the minimum demand and 1.0 for capacities greater than the maximum demand. This is the value used to calculate the CDF value of the Beta Distribution.
- CDF (%): The result of Cumulative Distribution Function of the Beta Distribution evaluated at the ratio defined above. This value represents the probability that the capacity demand will be less than the input capacity. The CDF is 0.0 for values less than the minimum capacity, meaning that the capacity demand will never be less that this. And the CDF is 1,0 for capacities greater than the maximum capacity, meaning that demand will always be equal to or lower than this.
In the next section, the term CDF(CX) is used to represent the Cumulative Distribution Function evaluated at a capacity of CX. C0 represents the lowest capacity, followed by C1 and so on to the highest capacity CN where N is the number of modulation states.
Traffic Demand - Custom Distribution
The traffic demand can also be user defined by importing a custom, measured Cumulative Distribution Function (CDF). Click Operations - Define Traffic Demand - Custom CDF Function. This dialog is similar to the one described above, but rather than the Beta Distribution parameters, there is a button to select the distribution file to import. Once a file is imported, the distribution information will be saved with the .pl6 link file.
Information how how to collect this data is included ETSI TR 104 141 document
Custom CDF File Format
The current file import format is a simple csv with optional description. A more robust format can be developed if required.
The file should be an ASCII text CSV (comma separated values) file with 2 columns. The first column lists the Traffic Demand in Mbps ordered from low to high (The lowest value will be the minimum traffic demand and the highest will be the maximum traffic demand for the link). The second column is the CDF results ie. the probability that the demand will be equal to or lower than Traffic Demand value for that row. These values must range from 0.0 to 1.0 and be non-decreasing.
The first lines of the ASCII file can be an optional description of the data. The CDF data read will start at the first line with the correct #,# format.
Example File Format with 3 line description:
Region: Vancouver B.C.

Period: Dec 2024 - Oct 2025

Contact: First Last (email)

25.000,0.0000

35.714,0.0625

46.429,0.1213

...

...

528.571,0.9932

539.286,0.9967

550.000,1.0000
Traffic Availability Results
Once a Traffic Demand Distribution has been defined, Backhaul Traffic Availability will be calculated. It will be displayed at the top info block of a ACM link either in Transmission Analysis module or Transmission Detail or Summary reports.
These values can also be used in CSV reports or used as rejection and display criteria for automatic link design.
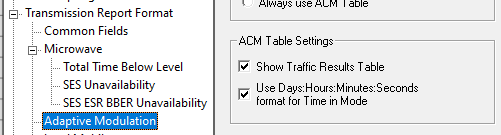
Show Traffic Results Table
Enable the Traffic Results Table from the Adaptive modulation section of the Program Options. (This option can also be enabled when exiting the Traffic Demand dialog.)
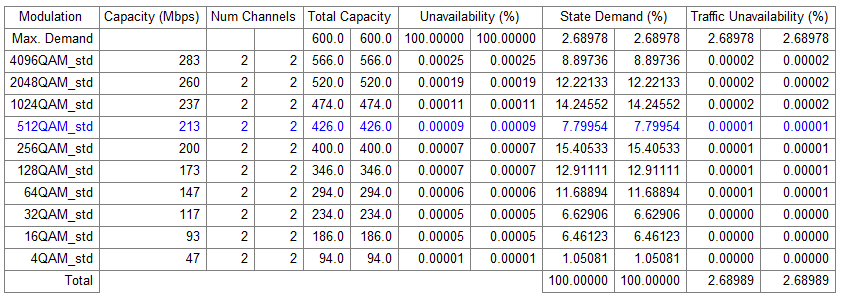
The following columns are shown in the Transmission Analysis Module Traffic Table:
- Modulation: The name of the modulation state from the radio file
- Capacity (Mbps): The listed capacity for this modulation state from the radio file.
- Num Channels: The number of channels used on this link. This value is equal to the number of entries in the channel table. If the channel table is empty, this value is set to 1 or 2 if XPIC operation is enabled.
- Total Capacity: The capacity total for this state using all channels (Capacity x Num Channels)
- Unavailability: The unavailability of this modulation state.
- State Demand: This value represents the probability that traffic demand will be between the capacity of this state and the next lower state. This is the range of capacity demand that depends on the availability of this state. It is equal to CDF(CX) - CDF(CX-1). The demand for the lowest available capacity (C0) is just CDF(C0)
- Max Demand Row: There is an additional row that is relevant if the maximum demand (CMAX) is greater than the maximum capacity of the link (CN). This row represents demand that can not be met by this link and will have an unavailability of 100%. The excess demand for this row is CDF(CMAX) - CDF(CN) or 1.0 – CDF(CN).
- Traffic Unavailability (%): This value represents the probability or time that traffic demand requiring this state will not be met. It is equal to the Excess Demand multiplied by the state’s Unavailability.
- Total Traffic Unavailability(%): is the sum of Traffic Unavailability. This value is shown at the bottom of the table and in the info block at the top of the report.