Difference between revisions of "Pathloss 5 - Where to begin"
(→Step 1 - Enter site information) |
(→Step 1 - Enter site information) |
||
| (9 intermediate revisions by one user not shown) | |||
| Line 1: | Line 1: | ||
This step by step tutorial is intended to help a first time user get the program up and running. It is intentionally kept simple and is designed to familiarize the user with Pathloss 5's layout and basic tools. | This step by step tutorial is intended to help a first time user get the program up and running. It is intentionally kept simple and is designed to familiarize the user with Pathloss 5's layout and basic tools. | ||
| − | For more information refer to the in program help ''(the help menu is located on the right side of the menu bar)'' | + | For more information refer to the in program help ''(the help menu is located on the right side of the menu bar)''. |
== Step 1 - Enter site information == | == Step 1 - Enter site information == | ||
| − | Open the Pathloss 5 program, you should see a window with a toolbar and menu. If there is a menu item called "Initialize Program" [[Pathloss_5_-_Download_and_installation#Initializing_Pathloss_5 | + | Open the Pathloss 5 program, you should see a window with a toolbar and menu. If there is a menu item called "Initialize Program", you must [[Pathloss_5_-_Download_and_installation#Initializing_Pathloss_5 | initialize the program]] before continuing. |
Click '''''View - Site List''''' to bring up the Site index. You can also click the Site list button on the toolbar. | Click '''''View - Site List''''' to bring up the Site index. You can also click the Site list button on the toolbar. | ||
| Line 13: | Line 13: | ||
We are going to manually add two site to the project. Click on the first cell in the Site Name Column. Enter a name for the site and press the Tab key to move the to next cell. Enter a Latitude for the site and press Tab. Enter a Longitude. This is the minimum required information for a site. Add a second site using the same method. | We are going to manually add two site to the project. Click on the first cell in the Site Name Column. Enter a name for the site and press the Tab key to move the to next cell. Enter a Latitude for the site and press Tab. Enter a Longitude. This is the minimum required information for a site. Add a second site using the same method. | ||
| − | [[File: | + | [[File:Site_list_021.JPG]] |
Close the Site list and the sites will be shown in the GIS window. | Close the Site list and the sites will be shown in the GIS window. | ||
| Line 25: | Line 25: | ||
Click the green check button [[File:Green-check.jpg]] to accept the settings changes. Make a note of the bounding coordinates so you will know what terrain data you need. | Click the green check button [[File:Green-check.jpg]] to accept the settings changes. Make a note of the bounding coordinates so you will know what terrain data you need. | ||
| − | [[File: | + | [[File:Geogrid2.JPG]] |
== Step 2 - Configure terrain data == | == Step 2 - Configure terrain data == | ||
| − | |||
| − | |||
| − | + | Terrain data is available from many sources in a wide variety of formats. For this example we will use SRTM terrain data. Full instructions on downloading and using this data is at [[SRTM]]. | |
| − | + | ||
| − | + | ||
| − | + | ||
| − | + | ||
| − | + | ||
| − | + | ||
| − | + | ||
| − | + | ||
| − | + | ||
| − | + | ||
| − | + | ||
| − | + | ||
| − | + | ||
| − | [[ | + | |
| − | + | ||
| − | + | ||
| − | + | ||
| − | + | ||
| − | + | ||
| − | + | ||
== Step 3 - Create the links == | == Step 3 - Create the links == | ||
Latest revision as of 15:34, 3 October 2018
This step by step tutorial is intended to help a first time user get the program up and running. It is intentionally kept simple and is designed to familiarize the user with Pathloss 5's layout and basic tools.
For more information refer to the in program help (the help menu is located on the right side of the menu bar).
Contents |
Step 1 - Enter site information
Open the Pathloss 5 program, you should see a window with a toolbar and menu. If there is a menu item called "Initialize Program", you must initialize the program before continuing.
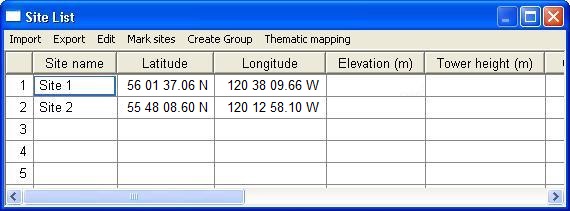
Click View - Site List to bring up the Site index. You can also click the Site list button on the toolbar.
We are going to manually add two site to the project. Click on the first cell in the Site Name Column. Enter a name for the site and press the Tab key to move the to next cell. Enter a Latitude for the site and press Tab. Enter a Longitude. This is the minimum required information for a site. Add a second site using the same method.
Close the Site list and the sites will be shown in the GIS window.
Sites can also me imported from a CSV file or any delimited text file. See Pathloss 5 - Import sites from text file.
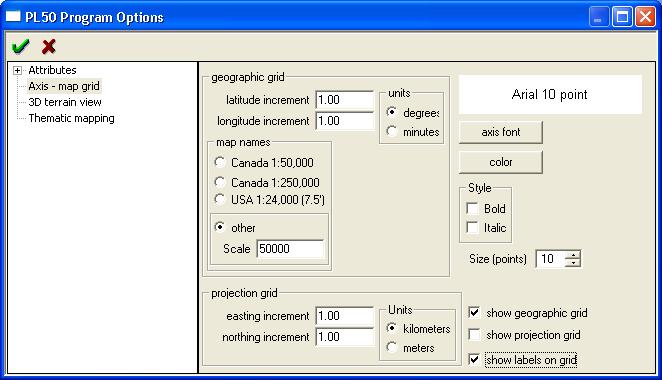
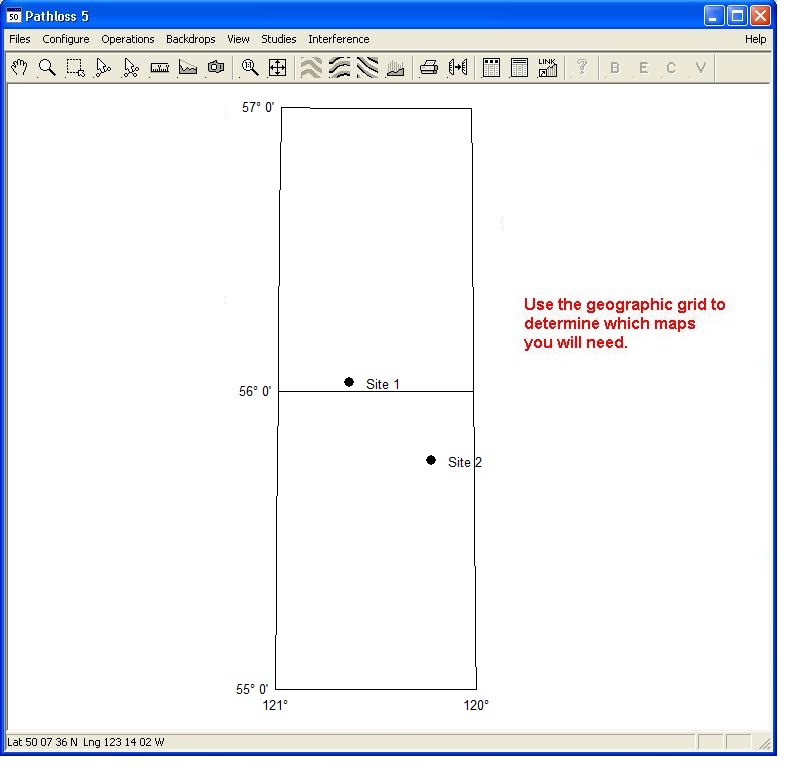
To determine what terrain data file(s) you will need, it is helpful to see a geographic grid. Click Configure - Options - Network display options. Click Axis - map grid. In the bottom right area, check Show Geographic Grid and Show Labels.
Click the green check button ![]() to accept the settings changes. Make a note of the bounding coordinates so you will know what terrain data you need.
to accept the settings changes. Make a note of the bounding coordinates so you will know what terrain data you need.
Step 2 - Configure terrain data
Terrain data is available from many sources in a wide variety of formats. For this example we will use SRTM terrain data. Full instructions on downloading and using this data is at SRTM.
Step 3 - Create the links
For this example we will manually link the sites.
You should see the 2 sites marked on the screen. The mouse wheel can be used to zoom the display in and out.
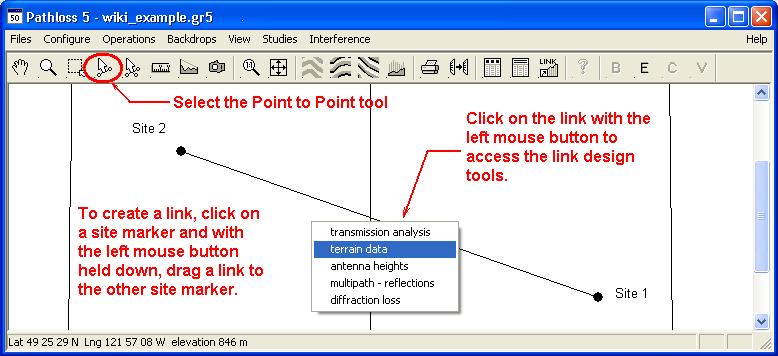
Select the Point to Point Link cursor from the toolbar. This cursor is used to create and interact with links.
Left click on one of the sites and drag to the other site to create the link. You can now left click on the link to access the modules of the link design tool.
Right clicking on links or sites will allow you to adjust attributes (appearance) and access other options.
Step 4 - Design the links
Generate Profile
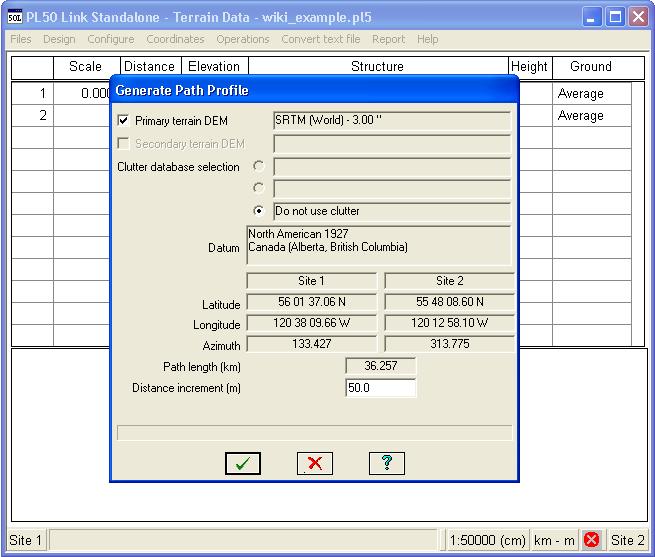
The first step in designing the link is to generate a path profile. Select the Point to Point Link tool and left click on the link. Select terrain data from the pop-up menu.
This opens the terrain data module in the link design tool. Click on Operations - Generate Profile. Make sure Primary Terrain DEM is selected and that the terrain database set up in the first step is shown. Click the green check mark to generate the profile.
Once the operation is finished, a status window will be displayed. Review this data carefully. It should display, "primary usage - 100.0%." If this is not shown or the usage is less than 100%, check the file listed and the directory, make sure the file exists and is in the correct directory.
Click the green check to close the status window.
Antenna Heights
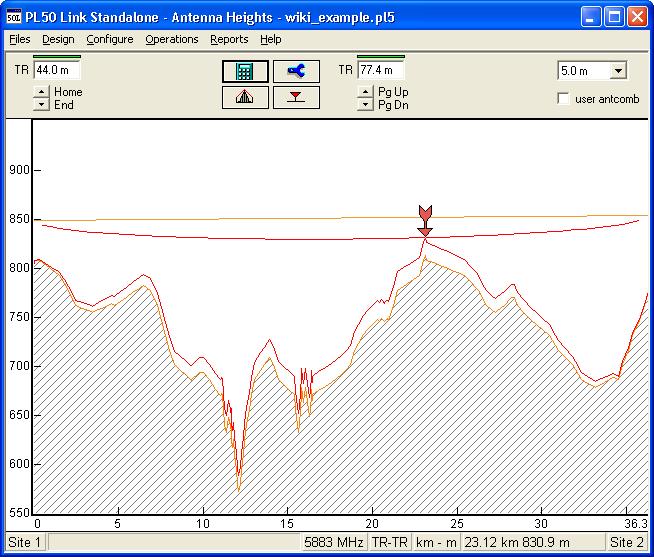
Once the profile has been generated, antenna heights can be calculated. Click on Design - Antenna heights to enter the antenna heights module.
Click the calculate button to calculate antenna heights that satisfy the clearance criteria (100%F1 at 4/3k is the default).
Transmission analysis
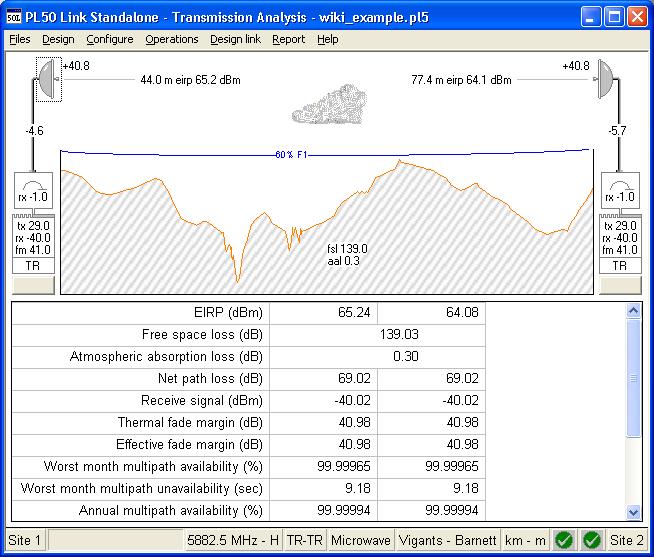
Click on Design - Transmission analysis to open the link budget section of the program.
The minimum required data for a complete reliability calculation is:
- Frequency
- Antenna gain
- TX Power
- RX Threshold level
- Path information (roughness, climatic factor, temp)
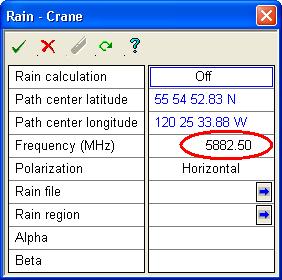
Click on the Rain cloud in the center of the path window, a dialog box will appear.
Enter the frequency in MHz. Click the green check button ![]() .
.
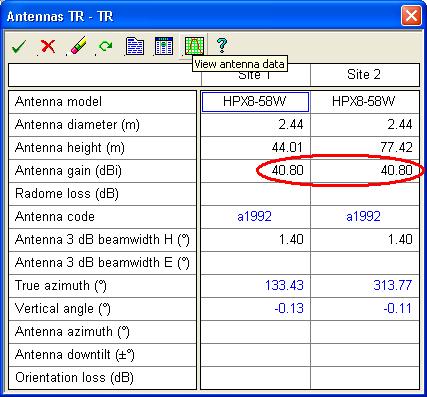
Click on the antenna graphic located on the left or right hand side of the screen. A dialog will appear.
Enter the antenna gain in the fields provided. You will need to specify the gain of the antenna for both site 1 and site 2. Click the green check button ![]()
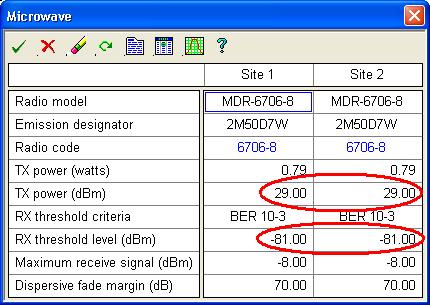
Click on the Radio graphic located on the left or right hand side of the screen. A dialog will appear.
Enter the TX Power in watts or dBm and the RX Threshold level in dBm for both sides of the link (both site 1 and site 2). Click the green check button ![]()
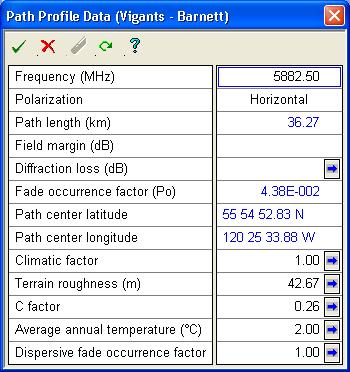
Click on the Terrain profile graphic located in the center of the screen. A dialog will appear.
The required fields will all have blue arrow buttons ![]() beside them. The blue arrow button will either calculate and populate the field or, in the case of Diffraction and Roughness, prompt for additional information.
beside them. The blue arrow button will either calculate and populate the field or, in the case of Diffraction and Roughness, prompt for additional information.
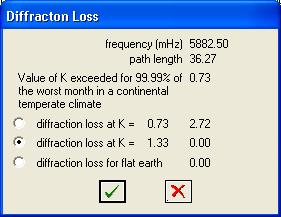
Start by clicking the blue arrow button for Diffraction loss. A dialog box will appear.
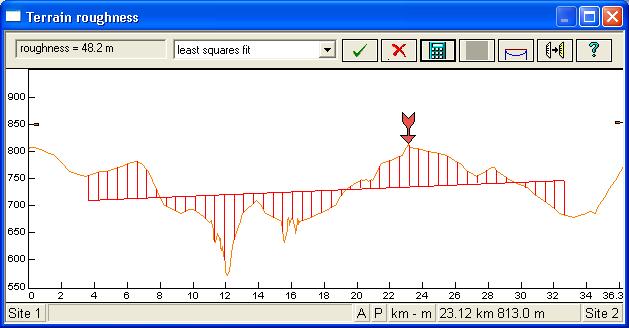
Accept the defaults by clicking the green check button ![]() . Next, click the blue arrow button for Climatic factor and then Terrain roughness after which a dialog will appear.
. Next, click the blue arrow button for Climatic factor and then Terrain roughness after which a dialog will appear.
Accept the default selections by clicking the calculator button followed by the green check button
![]() .
.
Finally, click the Average annual temperature blue arrow button. Click the green check button ![]() to accept and close the Path profile data dialog box.
to accept and close the Path profile data dialog box.
You should now have the reliability calculations visible in the main window.
Step 5 - Generate reports
From the Link Design Tool, select Design - Transmission Analysis
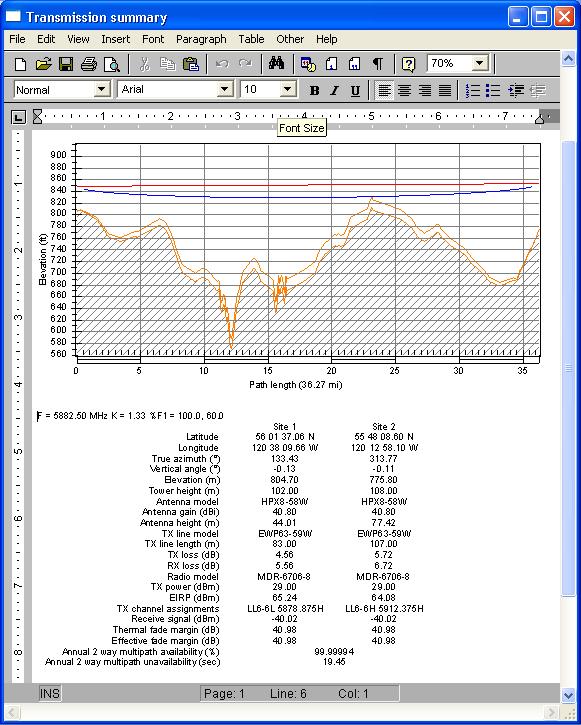
Select Report - Transmission Summary Report. This opens the report window which is actually a robust editor similar to MS Word.
Here you can make any final changes to the appearance of the report. When you are ready, click File - Print to print the report.
Each module has its own report format. As well, you can select Design - Reports to create batch reports including data from any module and across multiple link files.

